Geographic Information Systems (GIS)
At the heart of most of the research in the SpaCE2 Lab is the use of Geographic Information Systems (GIS). We use GIS to generate predictions of novel environmental exposures, to link participant addresses or GPS coordinates to relevant exposures, and to visualize spatial patterns of exposure.
We primarily use GIS to develop exposure predictions for participants in the cohorts we use. Below we highlight some of these exposure models

Particulate matter
Although we have used a variety of models for different projects, we have primarily used estimates of particulate matter developed by Dr. Jeff Yanosky at Penn State.

Ultraviolet radiation
As part of her postdoc, Dr. VoPham developed a model of summer UV that we have used in a variety of studies

Greenness
We historically used data on the Normalized Difference Vegetation Index (NDVI) from MODIS. More recently we have focused on using NDVI from Landstat, for its improved spatial and temporal coverage
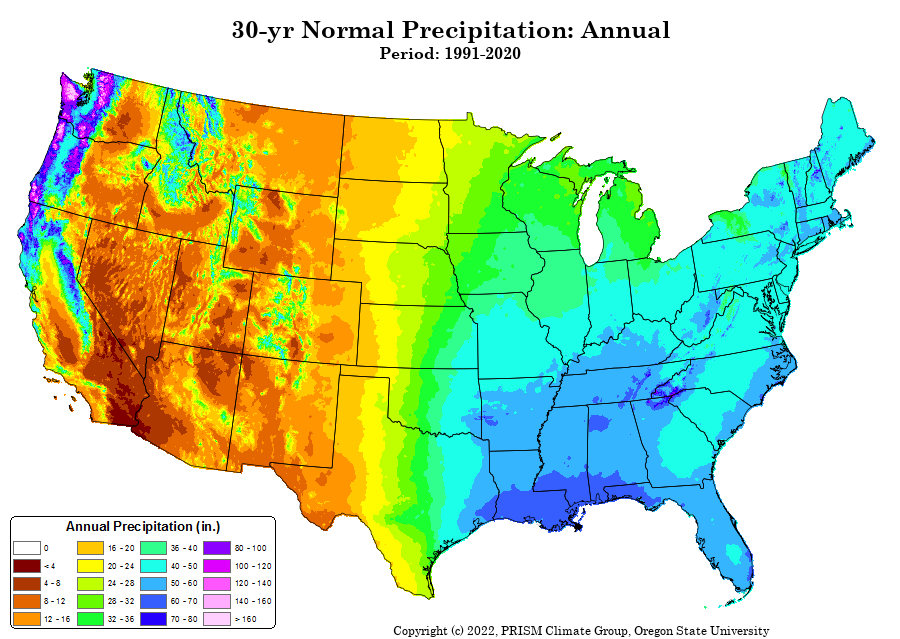
Temperature and humidity
We use daily and monthly estimates of climatic data from the Oregon State PRISM Climate group. (Map copyrighted PRISM Climate Group)