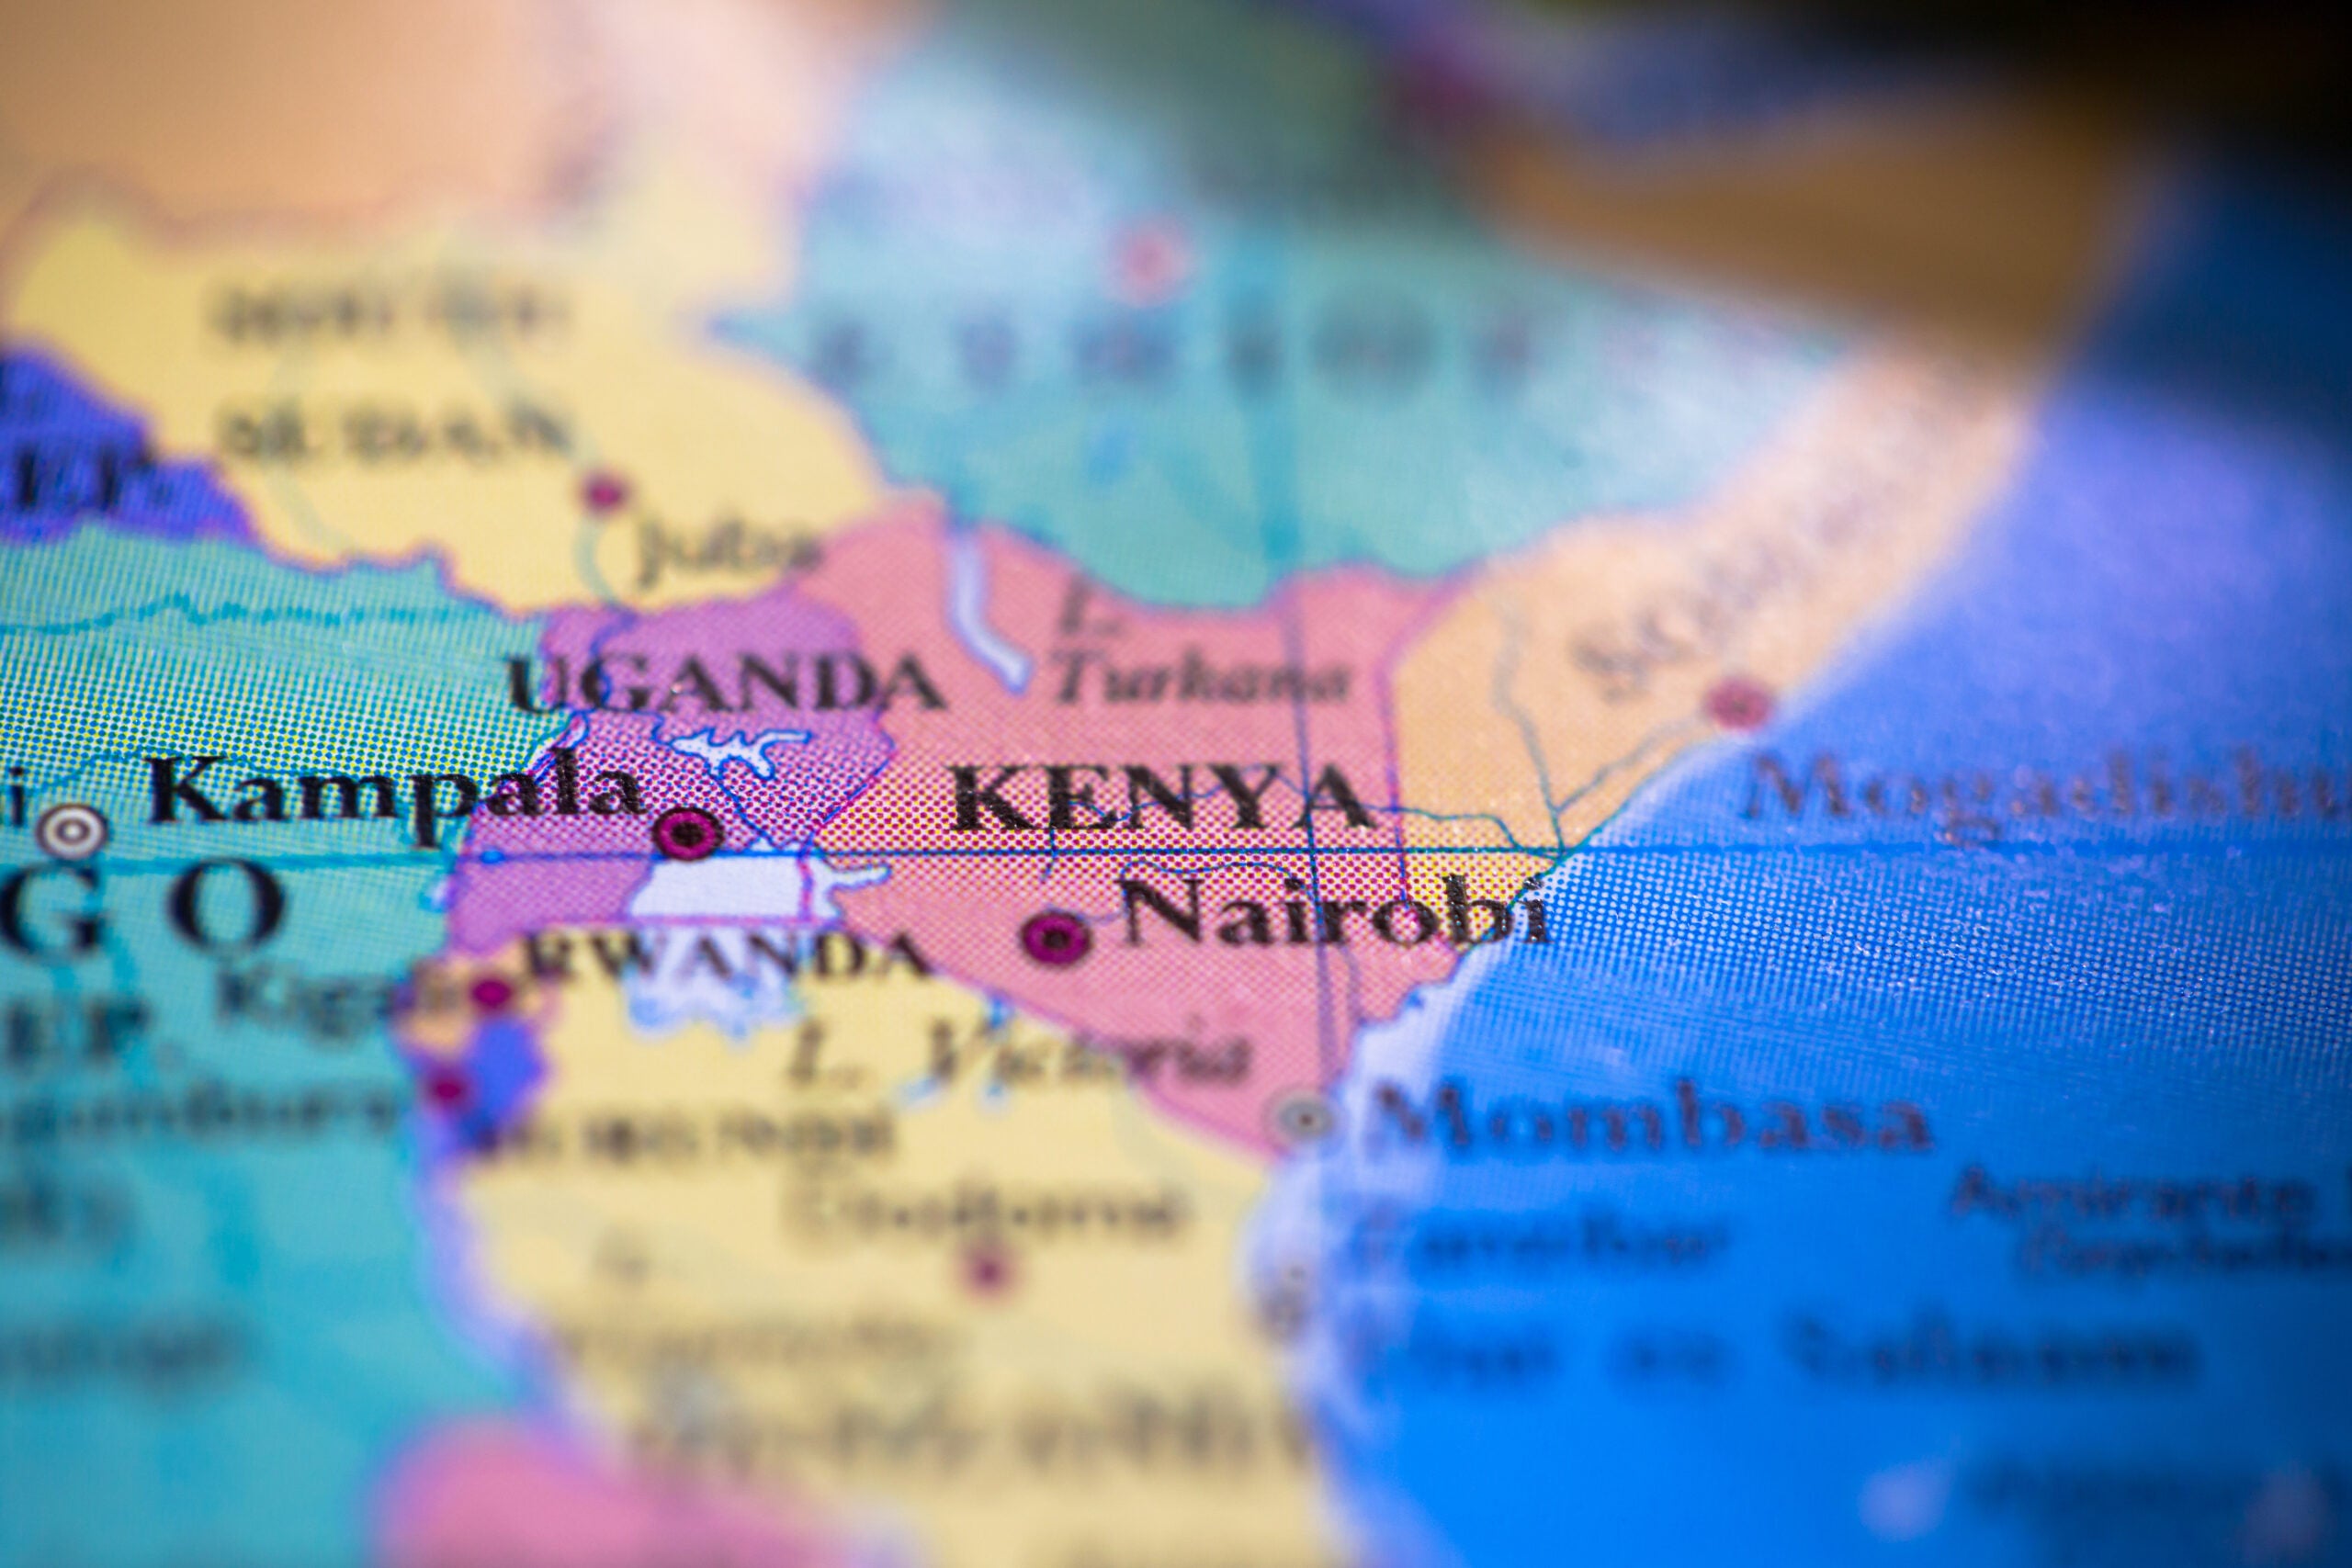
Using Spatial Analysis for Atrocity Prevention: A Critical Pathway in Kenya

Community-based early warning systems (EWS) are critical for identifying and addressing potential conflicts in Kenya—a nation that has experienced cycles of violence fueled by political tensions, ethnic divisions, and resource-based disputes. However, these systems face challenges such as misinformation, communication gaps, and resource limitations. Leveraging spatial analysis, through integrating geographic data and visualization tools, offers a transformative solution to enhance the efficacy of these systems for atrocity prevention.
Addressing Misinformation with Geographic Data
In Kenya, the reliability of field reports can be compromised by political biases or manipulated narratives. The Ushahidi platform, developed during Kenya’s 2007–2008 post-election violence, exemplifies how spatial tools can validate information (Marsden & Lungati, 2023). Ushahidi utilizes crowdsourced data to map reported incidents against historical and demographic trends, enabling stakeholders to identify verified hotspots of violence. By employing heatmaps and other visualization tools, decision-makers can act swiftly to prevent further escalation.
Enhancing Communication in Remote Areas
Rural regions in Kenya, such as Turkana and Garissa, often experience limited communication infrastructure, delaying the relay of vital information. Spatial tools, including satellite data and offline mapping systems, provide innovative solutions. For instance, mapping regions with poor network coverage highlights priority areas for infrastructure development (Makori, 2022). These tools also offer alternatives for emergency communication during mobile network outages, serving as a bridge between remote communities and central decision-making bodies.
Motivating and Empowering Volunteers
In conflict-prone counties like Nakuru and Kisumu, volunteer peace monitors play a pivotal role in EWS. Spatial analysis can visually demonstrate their impact by mapping declines in violent incidents over time, fostering a sense of accomplishment and motivation. Real-time dashboards showcasing their contributions in these areas further validate their efforts, sustaining engagement and participation (Ajao, 2017).
Overcoming Literacy Barriers
Low literacy levels in certain Kenyan regions, such as parts of Mandera and Wajir, can hinder accurate reporting by monitors. Spatial analysis provides a solution through user-friendly visual tools like icons and color-coded maps. These tools simplify complex data, making it accessible even to individuals with limited formal education, thereby enhancing inclusivity and effectiveness (Ogira et al., 2024).
Maintaining Neutrality and Reducing Bias
Given Kenya’s diverse ethnic landscape, neutrality is essential for the success of EWS. Spatial analysis can aid objectivity by presenting data impartially. It is important to note, however, that maps and other visualizations are only as neutral as the data that goes into them. This exemplifies the importance of curating a trusted network of data collectors and establishing data validation processes. Platforms like Ushahidi have demonstrated the value of unbiased geographic visualizations, fostering trust among communities and facilitating collaboration across diverse stakeholders (Marsden & Lungati, 2023).
Predicting Risks with Spatial Modeling
The predictive capabilities of spatial analysis are particularly relevant in Kenya’s context, where factors such as resource-based conflicts in arid areas and election-related tensions are recurrent issues. By combining historical violence data with indicators like drought patterns, economic inequalities, and political events, spatial tools can forecast potential conflict zones. This foresight enables strategic resource allocation and preemptive interventions (Makori, 2022).
Building Resilient Systems
Kenya’s vulnerability to technological disruptions, including cyberattacks and power outages, poses a risk to EWS functionality. Spatial tools address these challenges through offline capabilities and cloud-based backups, ensuring continuity in data access and communication. For instance, during the 2022 elections, organizations using spatial platforms were able to maintain situational awareness despite sporadic system interruptions (Ajao, 2017).
Conclusion
Spatial analysis is revolutionizing early warning systems, shifting them from reactive mechanisms to proactive frameworks. By addressing challenges like misinformation, communication barriers, and resource constraints, spatial tools enhance the accuracy, efficiency, and inclusivity of response efforts. These methods not only improve existing systems but also pave the way for scalable and resilient approaches to conflict prevention.
As conflicts grow more complex, integrating spatial analysis into EWS will become increasingly essential. Harnessing geographic data allows the global community to make meaningful progress in preventing violence and safeguarding vulnerable populations.
Dr. Mukoya is currently working as Head of Programs with Free Pentecostal Fellowship in Kenya (FPFK), focusing on peacebuilding, resilience and environmental management, gender advocacy, women’s and children’s rights, organizational strengthening, and humanitarian assistance.
References
- Ajao, M. (2017). Citizen empowerment through mapping and visualization. University of Pretoria. Retrieved from https://repository.up.ac.za/bitstream/handle/2263/65543/Ajao_Citizen_2017.pdf
- Makori, J. (2022). Enhancing conflict prevention in rural Kenya through spatial tools. International Journal of Digital Mapping Systems, 14(3). Retrieved from https://sciencepublishinggroup.com/article/10.11648/ijdsa.20241001.11
- Marsden, J., & Lungati, A. (2023). Ushahidi. In C. M. Burnett (Ed.), Evaluating Participatory Mapping Software (pp. 197–213). Springer International Publishing. https://link.springer.com/chapter/10.1007/978-3-031-19594-5_10
- Ogira, C., Kamau, R., Kamau, S., Bwoma, B. K., Komora, B. K., et al. (2024). Predicting Conflict Zones in Kenya Using a Point Process Model. International Journal of Data Science and Analysis, 10(1), 1-10. https://doi.org/10.11648/ijdsa.20241001.11